Debugging AI Agents in Production: Tools and Techniques
When your AI agent does something unexpected in production, how do you figure out what happened? Here are our debugging tools and techniques.
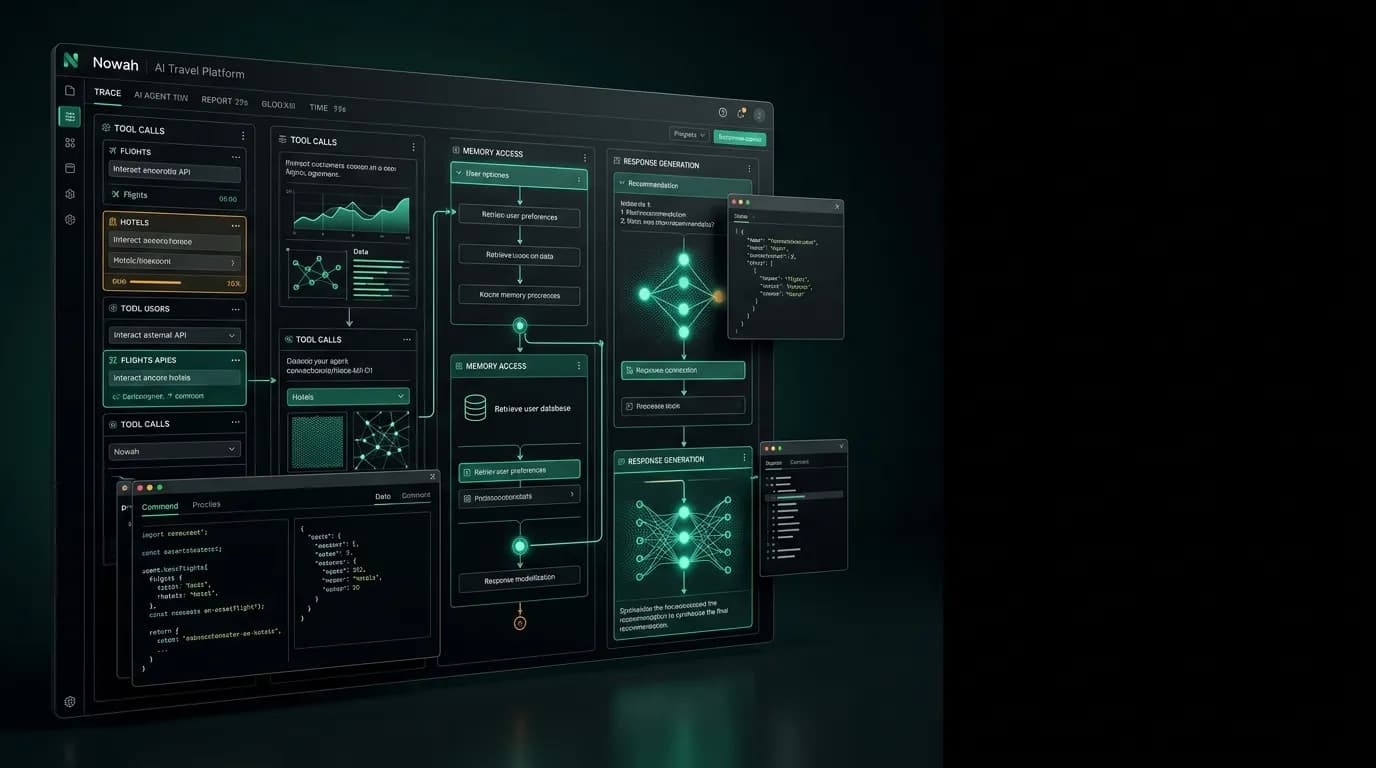
Last month, a user reported that our AI agent recommended a hotel in Barcelona that had been permanently closed for six months. The agent was confident. It described the hotel's amenities, quoted a nightly rate, and offered to book it. Everything looked right except the hotel did not exist anymore.
Debugging this was not like debugging a traditional software bug. There was no stack trace. No null pointer exception. No malformed query. The code executed perfectly. The AI just made a bad decision.
This is the fundamental challenge of debugging AI agents in production. The system can be working correctly at every technical layer while still producing a wrong outcome. Here is how we approach it.
Tracing AI agent decisions through logs
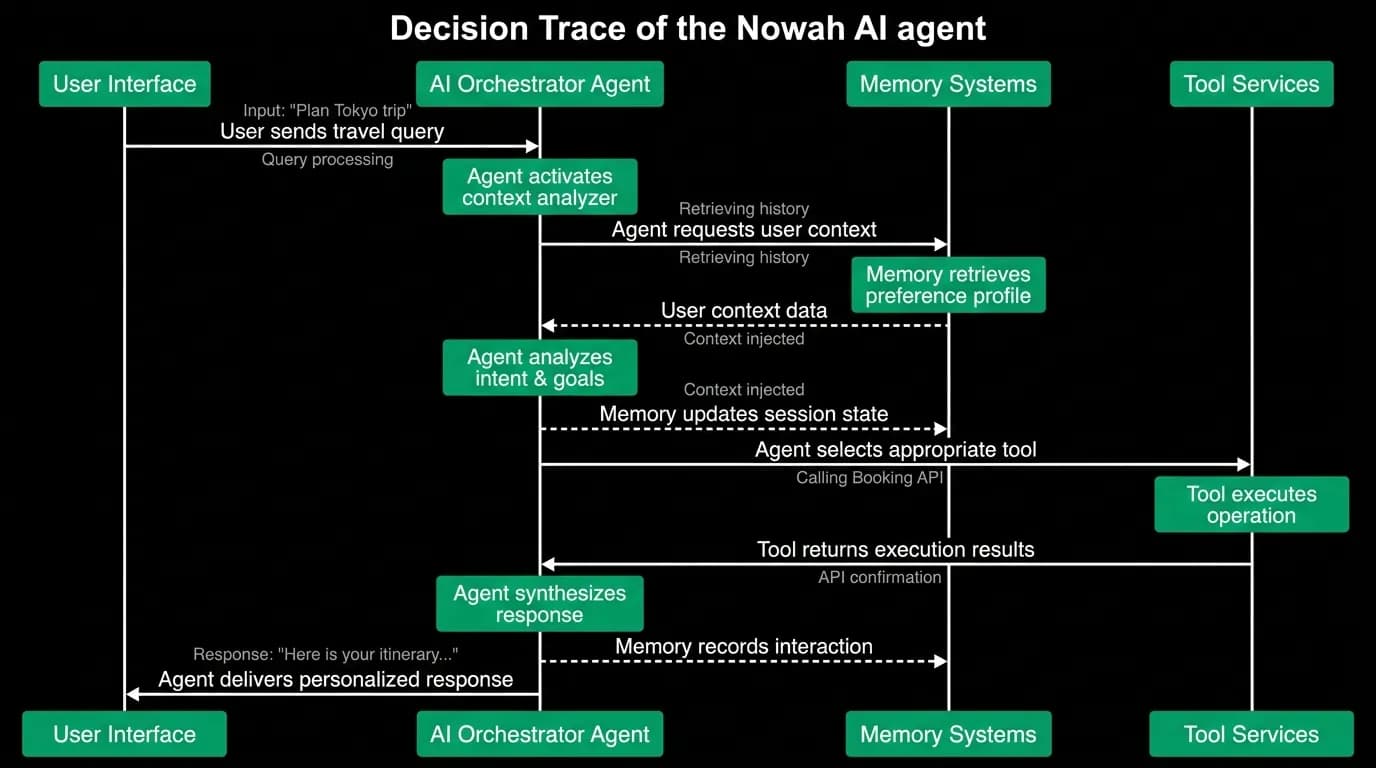
When a user reports a problem, the first thing we do is pull the decision trace for that conversation. Every interaction with our AI agent generates a structured log that captures the full decision chain: what the user said, what the agent "thought," which tools it decided to call, what parameters it used, what results it got back, and how it synthesized those results into a response.
For the Barcelona hotel case, the trace showed us exactly what happened. The user asked for hotels in Barcelona. The agent called the hotel search tool with the correct parameters. The search provider returned results that included the closed hotel because the provider's inventory data was stale. The agent ranked the hotel favorably because it matched the user's stated preferences (walkable neighborhood, boutique style, under $200/night). Nothing in the ranking logic knew the hotel was closed.
The bug was not in our code. It was in upstream data quality. But without the decision trace, we would have spent hours guessing. Was it a hallucination? A caching issue? A tool parameter error? The trace told us in minutes.
We log every tool call with its full input parameters and output results. We log the agent's reasoning (the "thinking" step before each action). We log memory retrieval results so we know what context the agent had. We log the final response construction so we can see how raw data became a user-facing message.
This is a lot of logging. The storage cost is meaningful. But the debugging speed it enables has paid for itself many times over.
Reproducing non-deterministic issues
Here is the frustrating reality of AI debugging: the same input will not reliably produce the same output. If a user reported that the agent gave bad flight recommendations, I cannot just replay their message and expect to see the same bad recommendations. The model might produce different reasoning, call tools in a different order, or weight results differently.
This makes traditional reproduction techniques insufficient. You cannot just "repro the bug" the way you would with a deterministic system.
Our approach has three parts.
First, we capture enough state to understand what happened without needing to reproduce it. The decision trace I described above gives us a complete record of the agent's behavior at the time of the incident. We do not need to reproduce the bug to understand it. We just read the trace.
Second, for cases where we do need to reproduce behavior (usually to verify a fix), we seed the conversation with the same user context, memory state, and message history. This does not guarantee identical output, but it produces behavior in the same neighborhood. If the original bug was caused by a tool parameter issue, the reproduction will likely hit the same issue because the parameter logic is deterministic even if the model's phrasing is not.
Third, we maintain a library of "golden conversations" that represent known-good behavior. When we suspect a regression, we run these golden conversations against the current agent and compare the behavior. Significant deviations flag potential issues.
Debugging tool call sequences
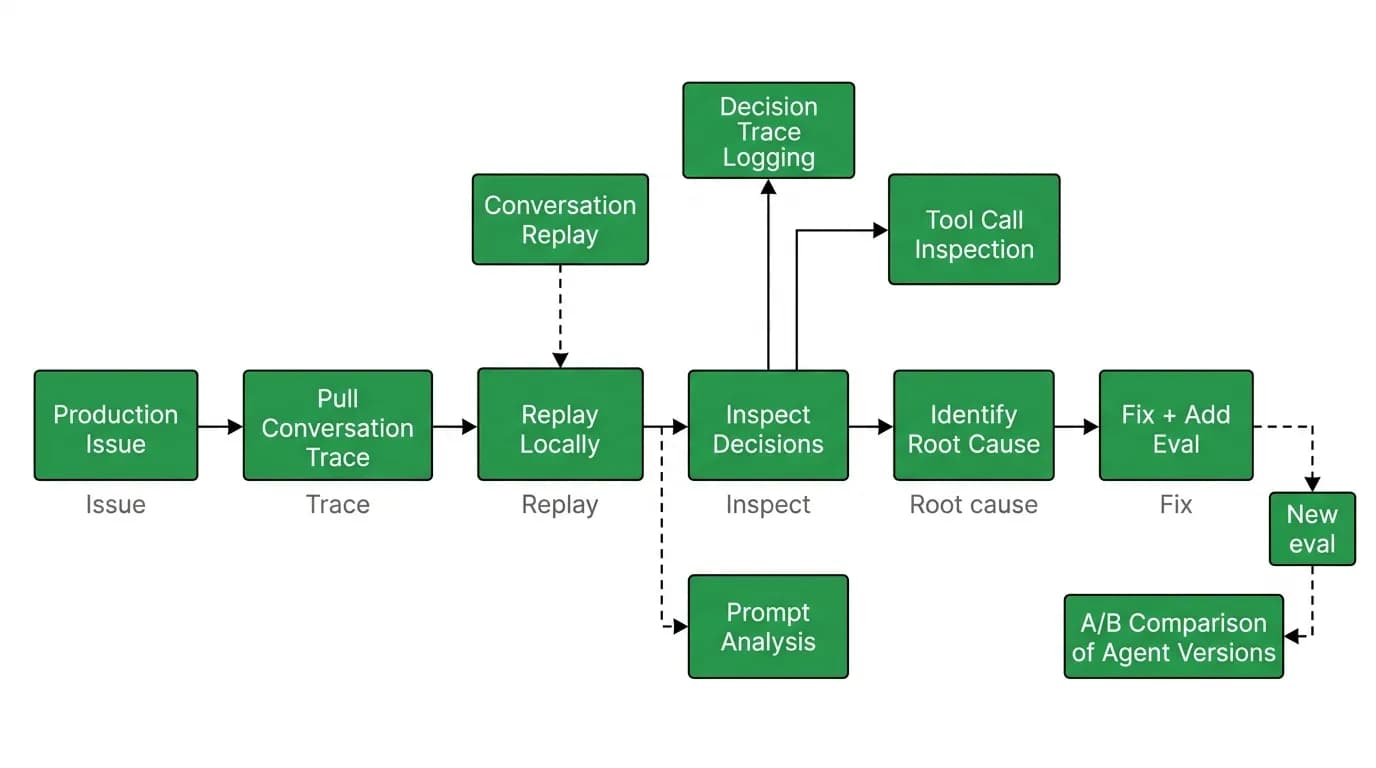
The most common category of AI agent bugs we encounter is incorrect tool call sequences. The agent called the right tools but in the wrong order. Or it called a tool with the wrong parameters. Or it called an unnecessary tool that slowed down the response. Or it failed to call a tool it should have called.
Tool call sequences are the primary debugging surface for agent behavior issues. When something goes wrong, the tool calls tell the story.
We built an internal trace viewer that visualizes the tool call sequence as a timeline. Each tool call is a node showing the tool name, input parameters, execution duration, and output summary. The timeline makes it easy to spot anomalies. A flight search that took 15 seconds when it normally takes 3. A hotel search called before the user specified dates. A booking confirmation tool called without a preceding payment tool.
The viewer also shows "counterfactual" annotations. When our eval system identifies a better tool sequence for a given input, it annotates the trace with what the optimal sequence would have been. This helps us understand not just what went wrong, but how far from optimal the agent's behavior was.
Conversation replay for issue reproduction
When a user reports an issue, we can replay their exact conversation in a debugging environment. This means loading the same message history, the same memory state, and the same conversation context, then stepping through the agent's decision process message by message.
Conversation replay requires capturing full context including memory state. This is harder than it sounds. The agent's memory is not just the messages in the current conversation. It includes long-term preferences learned from past interactions, trip context accumulated over multiple sessions, and real-time data from previous tool calls in the same conversation.
We snapshot all of this at the time of each agent invocation. When we replay, we restore the full snapshot. The replay will not produce identical output (non-determinism again), but it produces output generated from the identical context, which is usually enough to identify whether the issue was caused by context, by model behavior, or by tool execution.
Replay has caught bugs that no other debugging technique would have found. Context-dependent bugs where the agent behaves correctly in isolation but incorrectly when specific memory states are present. Ordering bugs where the sequence of messages in a conversation triggers unexpected behavior in the agent's reasoning. State accumulation bugs where the agent's internal state grows in ways that degrade later responses.
Building internal debugging tools
We invest time in internal tooling that most startups would consider a luxury. A trace viewer. A conversation browser. A decision inspector. An eval dashboard. These tools are not customer-facing. They exist solely to make our engineers faster at diagnosing and fixing issues.
The investment is justified because debugging AI agents is slow and expensive without them. An engineer staring at raw log files trying to reconstruct what an AI agent did is an engineer burning hours on something that should take minutes. Every hour we invest in debugging tooling saves dozens of hours in aggregate debugging time.
The conversation browser lets us search production conversations by various criteria: user, date range, tool calls made, error states, quality scores. When we see a pattern in user complaints, we can quickly pull up the relevant conversations and look for common failure modes.
The decision inspector lets us drill into a single agent turn and see every step of the decision process. What was in the prompt? What was the model's reasoning? Which tools were considered? Why was tool A chosen over tool B? What was the confidence level?
These tools are rough. They are not polished products. They are internal utilities built by engineers for engineers, and they look like it. But they work, and they make us measurably faster at finding and fixing problems.
How this differs from debugging traditional OTA logic
In a traditional OTA, debugging means finding the code path that produced a wrong result and fixing it. The search returned stale prices? Find the caching bug. The results were in the wrong order? Fix the sort logic. The booking failed? Check the API error code.
These are deterministic bugs. Given the same input, the same code path executes, and you can trace the execution to find the fault.
AI agent debugging is different because the "code" that made the decision is not code in the traditional sense. It is a model producing probabilistic outputs. You cannot step through it with a debugger. You cannot set a breakpoint on "the moment the agent decided to recommend the closed hotel."
What you can do is build the observability infrastructure to understand what the agent knew, what it did, and why. That is the entire debugging strategy: capture everything, build tools to navigate the captured data efficiently, and invest in the traces that let you reconstruct decisions after the fact.
It is more expensive than traditional debugging infrastructure. It is also more necessary. When your AI agent handles real bookings with real money, you cannot afford to shrug and say "the model just did a weird thing." You need to understand what happened, why, and how to prevent it next time.
Nowah is an AI travel agent that searches and books real flights and hotels through conversation — no filters, no thirty open tabs. Plan your next trip.