Observability for AI Agent API Consumption
Agent operators need visibility into their agent's API calls — traces, costs, error patterns, and anomaly detection. Here is how to build observability for agent traffic.
An agent burned through its rate limit in three minutes. The operator had no idea until users started getting errors. The agent had entered a retry loop on a provider timeout, making hundreds of search requests in rapid succession. By the time the rate limit kicked in, the session was unusable.
This is what happens when agent operators have no visibility into their agent's API behavior. Human developers monitor their integrations through dashboards and log viewers. Agent operators need something different: aggregate views of automated traffic patterns, cost attribution per conversation, and anomaly detection that catches runaway behavior before it causes damage.
Trace propagation
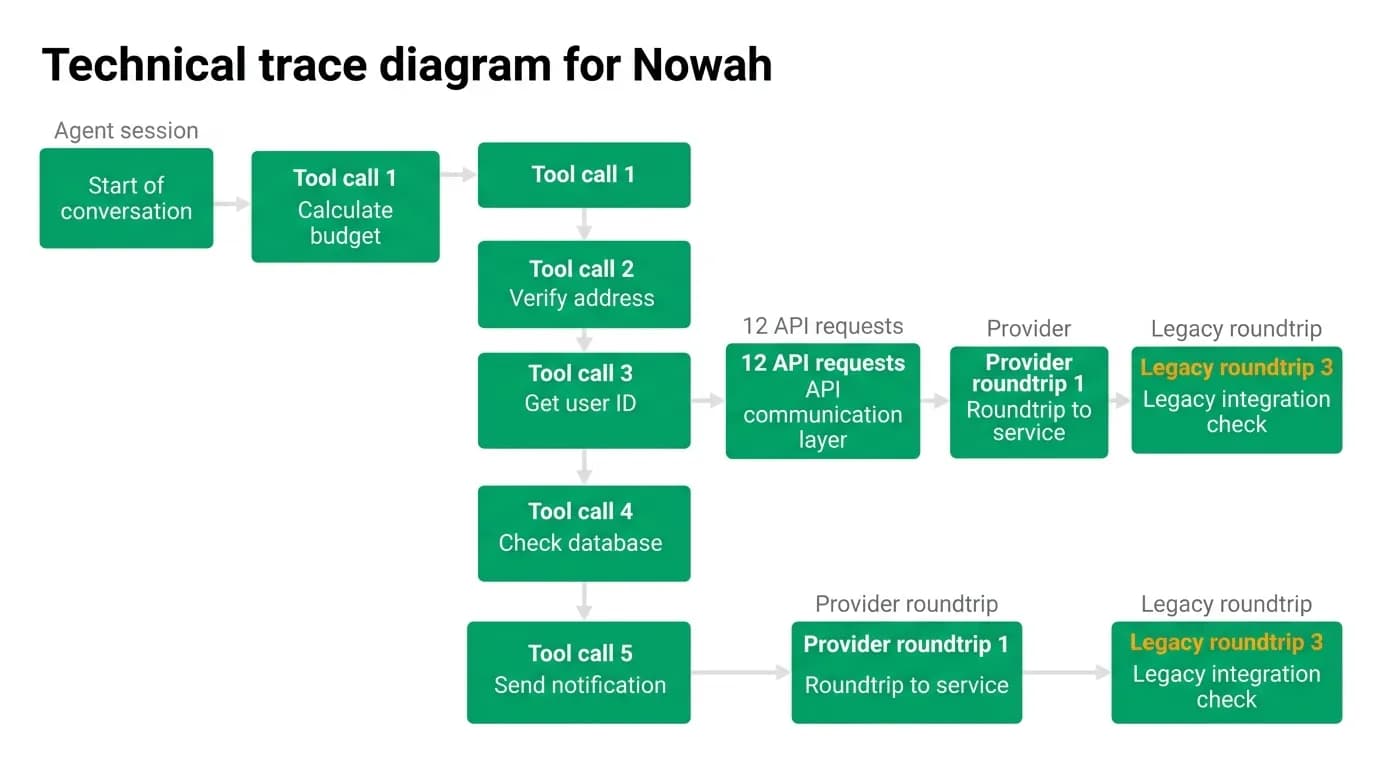
A single user message can trigger a cascade of API calls. The user says "find me flights and a hotel in Paris for next week." The agent calls the flight search tool. Then the hotel search tool. Then maybe a weather check tool. Each tool call maps to one or more API requests. Some requests fan out to multiple providers.
The trace chain looks like this:
User message → Agent session
 → Tool call: a flight-search capability → API request → Provider 1, Provider 2
 → Tool call: a hotel-search capability → API request → Provider 3
 → Tool call: get_weather → API request → Weather service
From one user message: one agent session, three tool calls, four API requests, and three provider roundtrips. Without trace propagation, these are disconnected entries in different logs. With trace propagation, they are all connected by a session ID.
We propagate the agent session ID through every tool call and API request. The session ID appears in API request headers, in response metadata, in billing records, and in logs. An operator who looks up a session sees the complete chain: what the user asked, what the agent did, what API calls were made, and what they cost.
Cost attribution
Agent operators need to know what their agents cost. Not just in aggregate ("you made 10,000 API calls this month") but per conversation.
Each API call has a cost. Search calls are priced by the number of providers queried. Booking calls have a per-transaction fee. The total cost of a conversation is the sum of all API calls the agent made during that session.
We attribute costs to sessions automatically. The session ID on each API request links the cost to the conversation. The operator's dashboard shows:
- Average cost per conversation.
- Cost distribution across conversations (most are cheap, some are expensive).
- Cost breakdown by tool call type (searches vs. bookings vs. informational queries).
- Trends over time.
This data feeds into product decisions. If the average conversation costs more than expected, the operator can investigate which tool calls are driving the cost. Maybe the agent is making redundant searches. Maybe it is querying too many providers when fewer would suffice. Cost visibility enables optimization.
Error pattern detection

Individual errors are normal. Patterns of errors signal a problem.
We monitor error rates per agent session and surface patterns:
- Spike detection: error rate suddenly increases. This might indicate a provider outage, a broken tool schema, or a regression in the agent's logic.
- Persistent failure: the same error code appears repeatedly across different sessions. This might indicate a configuration problem or an API change that the agent has not adapted to.
- Session failure: a conversation where every tool call fails. This usually indicates an authentication problem or a systemic issue.
Error patterns are detected over a rolling 7-day baseline. When the current error rate deviates by more than two standard deviations from the baseline, we trigger an alert. The alert includes which errors spiked, which sessions are affected, and the probable cause.
For agent operators, these alerts are more useful than individual error logs. An operator does not want to review every error. They want to know when something has changed and needs attention.
Anomaly detection
Beyond errors, we watch for behavioral anomalies — deviations from the agent's normal traffic patterns.
Normal behavior for a travel agent might be: 5-10 search calls per session, 0-1 booking calls, sessions lasting 2-10 minutes. An anomaly might be: 200 search calls in a single session, or a session lasting 4 hours, or booking attempts at 3 AM when the agent normally has no traffic.
These anomalies do not necessarily indicate errors. But they often indicate bugs. The 200-search-call session was probably a retry loop. The 4-hour session was probably a stuck agent that never terminated its conversation. The 3 AM bookings might be a time zone handling bug.
Our anomaly detection establishes baselines per API key and alerts when behavior diverges. The operator gets a notification with the session details and can investigate immediately rather than discovering the problem through a user complaint or a surprising bill.
Usage dashboards for agent operators
Agent operators need different dashboards than traditional API consumers.
A traditional developer wants to see individual requests: "my search call returned 200 OK in 340ms." An agent operator wants to see aggregates: "my agent made 5,000 search calls today with a 98.2% success rate and an average latency of 420ms."
We build agent-specific dashboard views:
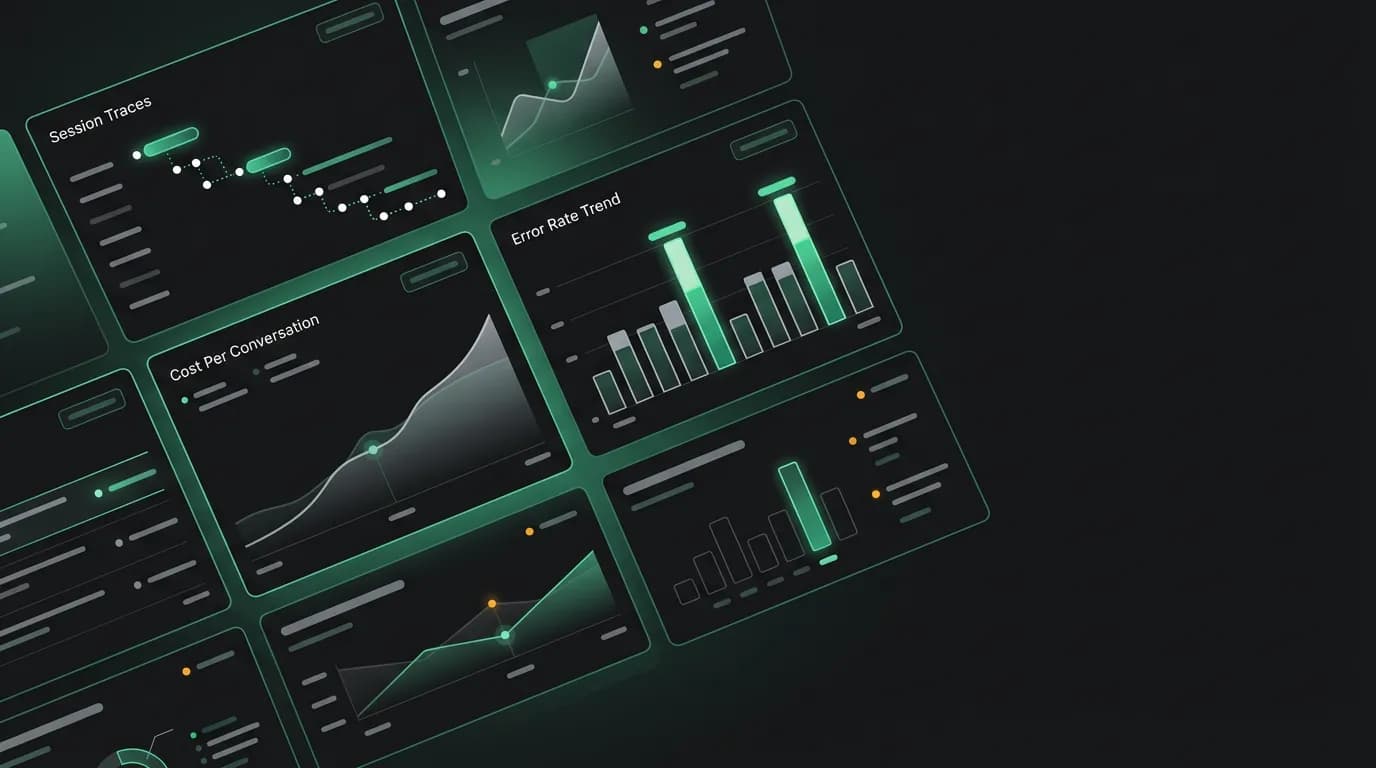
- Sessions per hour: how many conversations the agent is handling.
- API calls per session: average, p50, p95. Spikes indicate chatty agents.
- Error rate trend: daily error rate with 7-day moving average.
- Cost per session: distribution chart with median, mean, and outliers.
- Top error codes: which errors are most common, with links to affected sessions.
- Provider health: success rate and latency for each upstream provider, broken out from agent-level metrics.
The dashboard updates in near-real-time. An operator managing an agent that handles hundreds of concurrent conversations needs current data, not yesterday's summary.
Building agent observability
If you are building observability for agent API traffic, start with these priorities:
Session-level traces. Connect all API calls from one agent conversation with a shared session ID. This is the foundation for everything else.
Cost attribution. Calculate the cost of each conversation. Without this, operators have no way to optimize or budget.
Error aggregation. Surface error patterns, not individual errors. Operators need trends, not noise.
Anomaly baselines. Establish what normal looks like and alert when behavior deviates.
The investment is worth it. Agent traffic grows faster than human traffic, and unobserved agent traffic is a risk. An agent with a retry bug can accumulate costs, exhaust rate limits, and degrade service before anyone notices. Observability turns "nobody noticed until users complained" into "we caught it in three minutes and fixed it."
Nowah is an AI travel agent that searches and books real flights and hotels through conversation — no filters, no thirty open tabs. Plan your next trip.