What We Learned From Our Worst Production Incident
A blameless retrospective on the time everything went wrong and how we rebuilt better — incident timeline, root cause analysis, and the process changes that followed.

2:47 AM on a Tuesday. The first alert fired. A booking success rate drop. The on-call engineer checked the dashboard, saw a brief dip that had already recovered, and went back to sleep. That was the first mistake. Not because the engineer was negligent. Because the alert didn't convey the severity of what was starting.
By 3:15 AM, the alert fired again. This time the dip was deeper and it wasn't recovering. By 3:30 AM, three more alerts joined it. By 4:00 AM, we were in a full incident response with four engineers on a call, and the platform was substantially degraded for every traveler.
This is the story of our worst production incident, told without blame, with full honesty about what went wrong and what we changed afterward. We're sharing it because we learned more from this one incident than from six months of normal operations, and because most teams learn these lessons the hard way. Maybe you won't have to.
The timeline
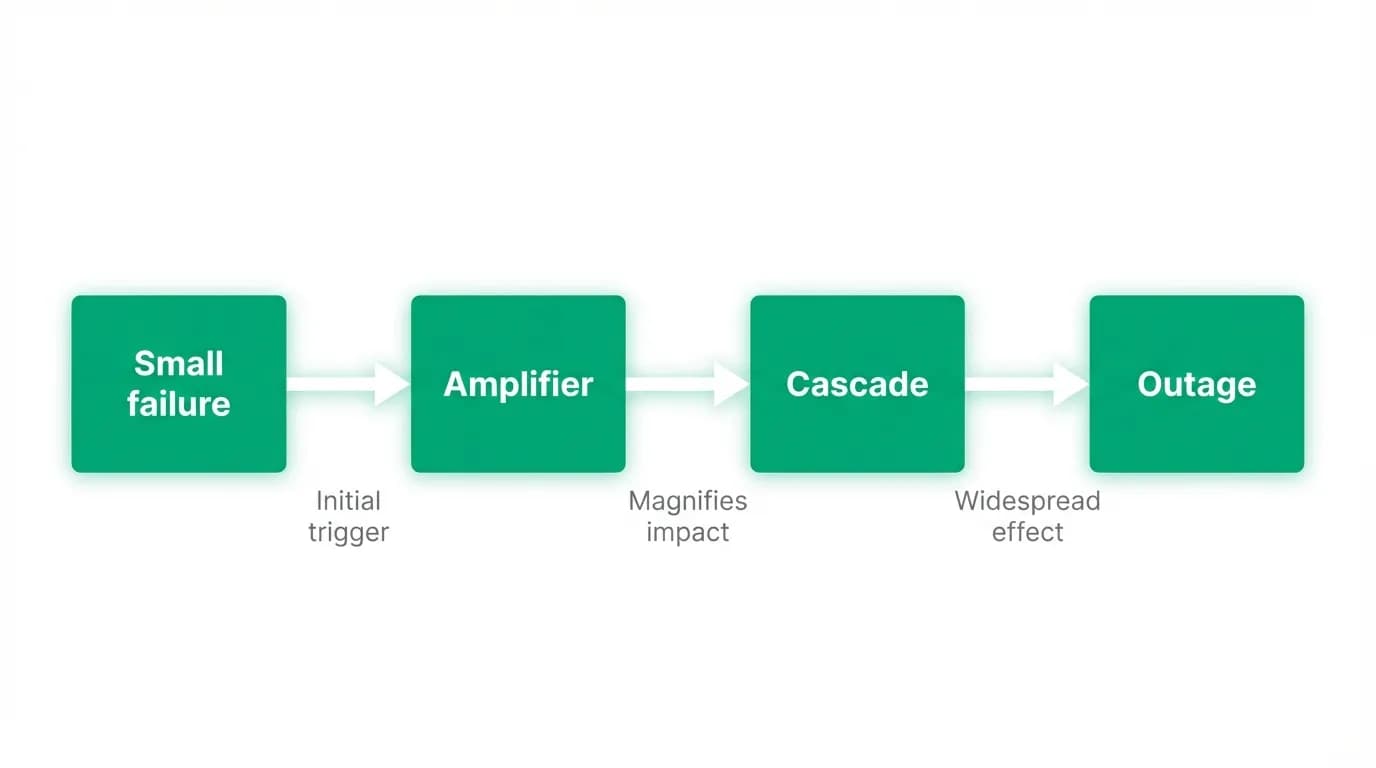
2:47 AM. The booking success rate alert fires. Rate dropped from 98.2% to 91% over the last 5 minutes. On-call engineer checks the dashboard. The rate has recovered to 96%. Appears transient. No action taken.
3:12 AM. Same alert fires again. Rate is at 87% and falling. On-call engineer begins investigation. Checks the API server logs. Sees elevated error rates on booking confirmation requests. The errors are timeouts from the travel data provider.
3:22 AM. The engineer checks the travel data provider's status page. No reported issues. Checks our connection to the provider. Connections are healthy. The hypothesis: the provider is experiencing elevated latency that hasn't hit their alerting thresholds yet. The engineer increases the timeout on booking confirmations from 10 seconds to 20 seconds.
This was the wrong first hypothesis. The provider wasn't slow. Something else was happening. But the timeout change seemed to help briefly because it masked the real problem.
3:35 AM. Queue depth alert fires. The booking queue has 200+ jobs backed up. Normally it's under 10. The engineer checks the workers. All workers are busy. They're not stuck. They're processing, but every job is taking 3-4x longer than normal.
3:42 AM. Database connection pool alert fires. Pool utilization is at 95%. Now the engineer escalates. Two more engineers join the call.
3:50 AM. One of the joining engineers notices something the first missed: the slow jobs aren't slow because of the travel data provider. They're slow because every database query is taking 5-10x longer than normal. The database is the bottleneck, not the external API.
3:55 AM. They check the database metrics. CPU is at 30%. Memory is fine. Connections are near the limit. IOPS are through the roof. The disk is the bottleneck. Something is generating massive disk I/O.
4:02 AM. A fourth engineer, who had been woken up by the escalation, checks the recent deployments. A deployment had gone out at 2:30 AM. It included a new analytics query that runs on every booking to calculate creator earnings in real time. The query does a full table scan on the booking history table. Every booking triggers it. It's been running for 30 minutes, and each invocation scans millions of rows.
4:08 AM. They roll back the deployment. The analytics query stops. Within 5 minutes, database I/O returns to normal. Query times recover. The booking queue drains. Success rate returns to 98%+.
Total incident duration: 81 minutes from first alert to resolution. 46 minutes from escalation to root cause identification. The platform was meaningfully degraded for about an hour.
Root cause analysis
The immediate cause was a database query that performed a full table scan on a large table, triggered once per booking. But calling that the root cause would be incomplete. Multiple things failed for this to become an 81-minute incident.
The query wasn't caught in review. The pull request was reviewed, but the reviewer focused on the application logic and didn't evaluate the query's performance characteristics. The query looked reasonable in isolation. Nobody asked "what happens when this runs against a table with millions of rows?"
The query wasn't tested against production-scale data. The staging database had 10,000 booking records. The production database had 2 million. The query performed fine in staging (50ms) and catastrophically in production (8 seconds). The staging environment didn't represent production's data volume.
The deployment happened at 2:30 AM. We had no deployment windows or restrictions. Any merge to main deployed immediately. A deployment at 2:30 AM meant reduced staffing and slower response when things went wrong.
The first alert was dismissed. The booking success rate dip looked transient because the timeout hadn't fully propagated yet. The alert didn't include enough context to suggest a deployment-related cause. The on-call engineer had no easy way to correlate the alert with the recent deployment.
The wrong hypothesis delayed resolution. The initial assumption was an external provider issue. This was reasonable but wrong. Twenty minutes were spent investigating the wrong system. There was no structured diagnostic process that would have directed attention to the database earlier.
Immediate fixes
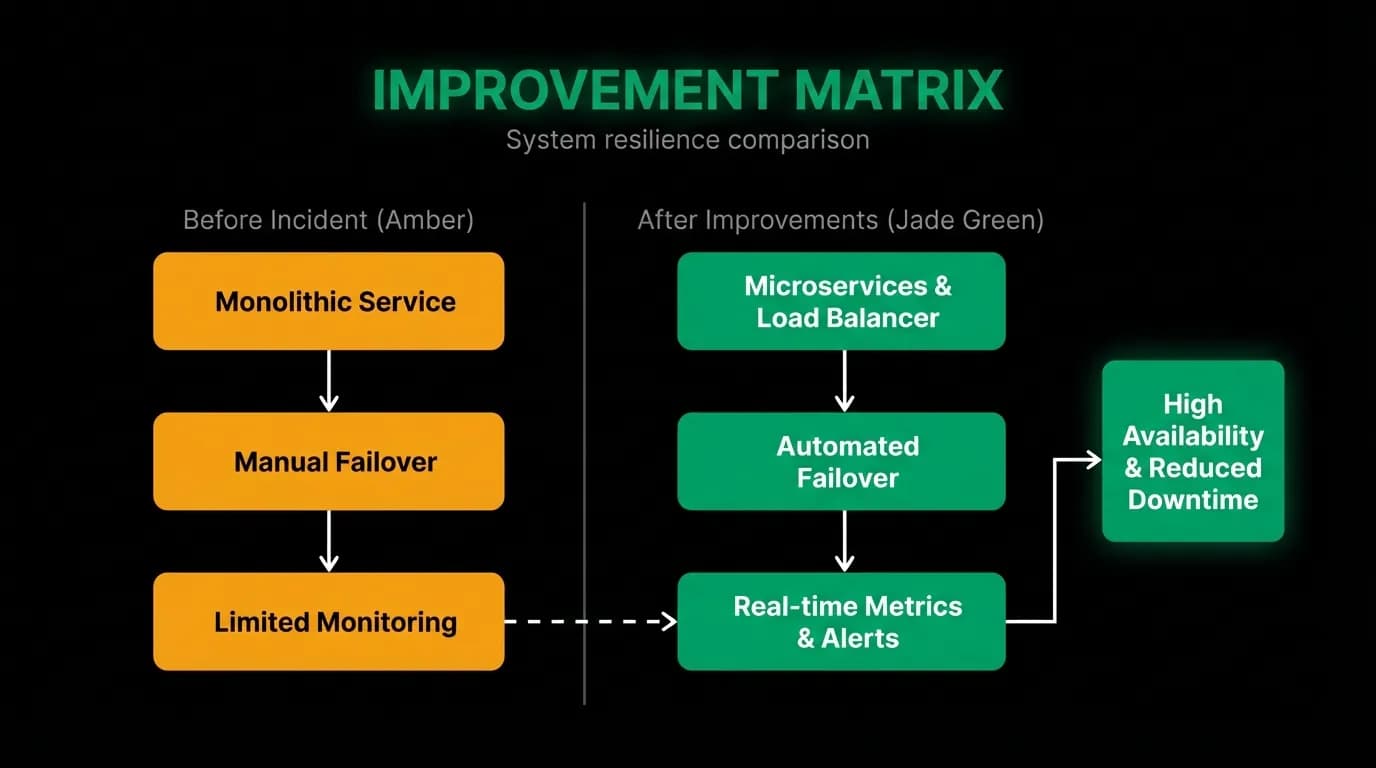
We rolled back the deployment and the incident resolved. But the analytics query was a legitimate feature request. We needed the real-time earnings calculation. We just needed it to not destroy the database.
The fix was an index. The full table scan happened because the query filtered on a column that wasn't indexed. Adding the index reduced the query from 8 seconds to 12 milliseconds. We also added a materialized view that pre-computes the earnings aggregation, so the per-booking query only touches recent records.
We redeployed the fixed version the next day, during business hours, with explicit monitoring of database I/O throughout the rollout.
Process changes
The incident exposed five gaps in our process. We addressed each one.
Query performance review. Every pull request that adds or modifies a database query now requires a query plan analysis. The reviewer must confirm that the query uses indexes and doesn't perform full table scans on large tables. We added a linting step that flags queries without WHERE clauses on indexed columns.
Production-scale staging data. Our staging database now contains a representative sample of production data volume. Not production data (that would be a privacy issue), but synthetic data at production scale. Queries that perform well against 10,000 rows but poorly against 2 million rows are caught before they reach production.
Deployment windows. We no longer deploy to production between 10 PM and 8 AM except for emergency hotfixes. Deployments happen when the team is awake, alert, and staffed to respond to issues. Off-hours deployments require explicit approval and a second engineer standing by.
Deployment-correlated alerting. Our alerts now include a "recent deployments" section. When an alert fires, the notification includes the list of deployments that happened in the last 2 hours. The on-call engineer immediately sees "a deployment went out 17 minutes before this alert started" and can prioritize investigating the deployment as a potential cause.
Structured diagnostic runbook. We created a diagnostic sequence for booking success rate alerts: (1) check for recent deployments, (2) check database metrics, (3) check external provider status, (4) check queue depth and worker health, (5) check resource utilization. The runbook prevents the "wrong first hypothesis" problem by ensuring the most common causes are checked in order of likelihood.
How it shaped our philosophy
This incident changed how we think about infrastructure. Not dramatically. We didn't throw everything out and start over. But several beliefs that were theoretical became visceral.
Staging must represent production. Not perfectly. Not a 1:1 copy. But staging must represent production's scale characteristics. If production has a million rows, staging should too. If production handles 100 requests per second, staging load tests should simulate that.
Deployments are a risk event. Every deployment introduces the possibility of a new failure mode. We treat deployments with respect. We don't deploy casually. We don't deploy when the team isn't available to respond.
The first hypothesis is usually wrong. When an incident starts, the natural tendency is to blame the most recent change or the most unreliable dependency. Sometimes that's correct. Often it's not. A structured diagnostic process that checks multiple systems in order of likelihood is faster than intuition.
Alerts need context. An alert that says "booking rate dropped" is less useful than an alert that says "booking rate dropped, and a deployment happened 17 minutes ago, and database I/O is elevated." Context turns an alert from a puzzle into a diagnosis.
Nobody should be blamed. The engineer who dismissed the first alert made a reasonable decision with the information available. The developer who wrote the slow query didn't know the table had 2 million rows. The reviewer who approved the PR was focused on correctness, not performance. The process failed, not the people. Every process change we made addressed the system, not the individuals.
Write your own blameless retrospective
If you haven't had a major incident yet, you will. When it happens, run a blameless retrospective within 48 hours. Here's the format that works for us.
Start with the timeline. Minute by minute. What happened, when, and what actions were taken. No judgments in the timeline. Just facts.
Identify the root causes. Usually plural. A single event rarely causes an incident. A chain of failures does. Identify every link in the chain.
Separate immediate fixes from long-term improvements. The immediate fix stops the bleeding. The long-term improvement prevents the same bleeding from happening again. Both are necessary. Neither is sufficient alone.
Assign owners and deadlines to every improvement. A retrospective without follow-up is just a meeting. Each improvement gets an owner, a deadline, and a tracking item. Review progress weekly until everything is done.
Share the retrospective widely. The lessons from one team's incident benefit every team. We publish our retrospectives internally. Other teams have caught similar issues in their own systems after reading about ours.
The goal isn't to prevent all incidents. That's impossible. The goal is to never have the same incident twice. Every incident teaches you something. The retrospective is how you make sure the lesson sticks.
Nowah is an AI travel agent that searches and books real flights and hotels through conversation — no filters, no thirty open tabs. Plan your next trip.