Queue Depth as a Health Signal
How monitoring job queue depth tells us more about system health than traditional metrics — a leading indicator of trouble before users notice.
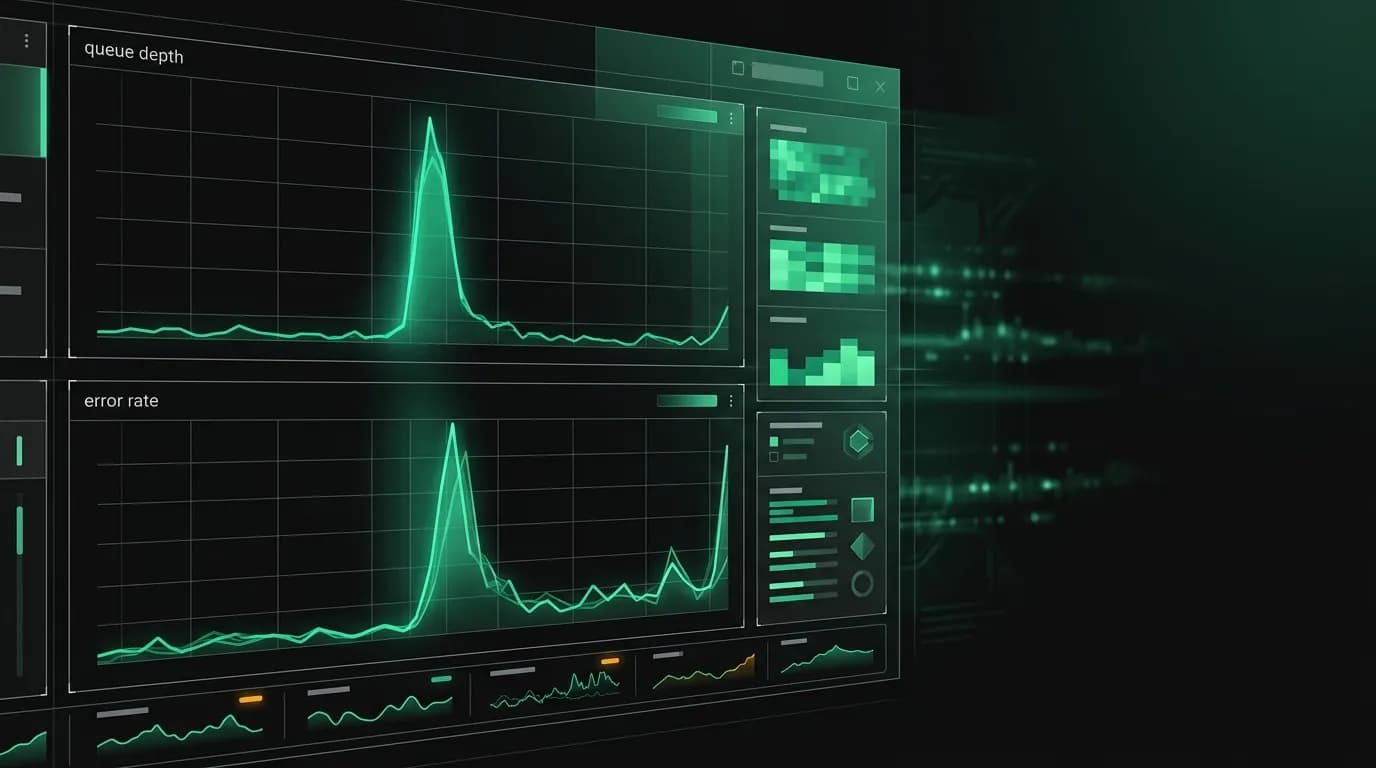
The queue is 10x deeper than normal. No travelers have complained yet. Error rates look fine. Latency metrics are within range. Everything appears healthy.
You have about 5 minutes before everything is not healthy.
This is the thing about queue depth that makes it so valuable as a monitoring metric: it's a leading indicator. It tells you about problems that are forming, not problems that have arrived. By the time error rates spike and latency degrades and travelers start complaining, the queue has been screaming at you for minutes. If you're watching.
Why queue depth leads and error rates lag
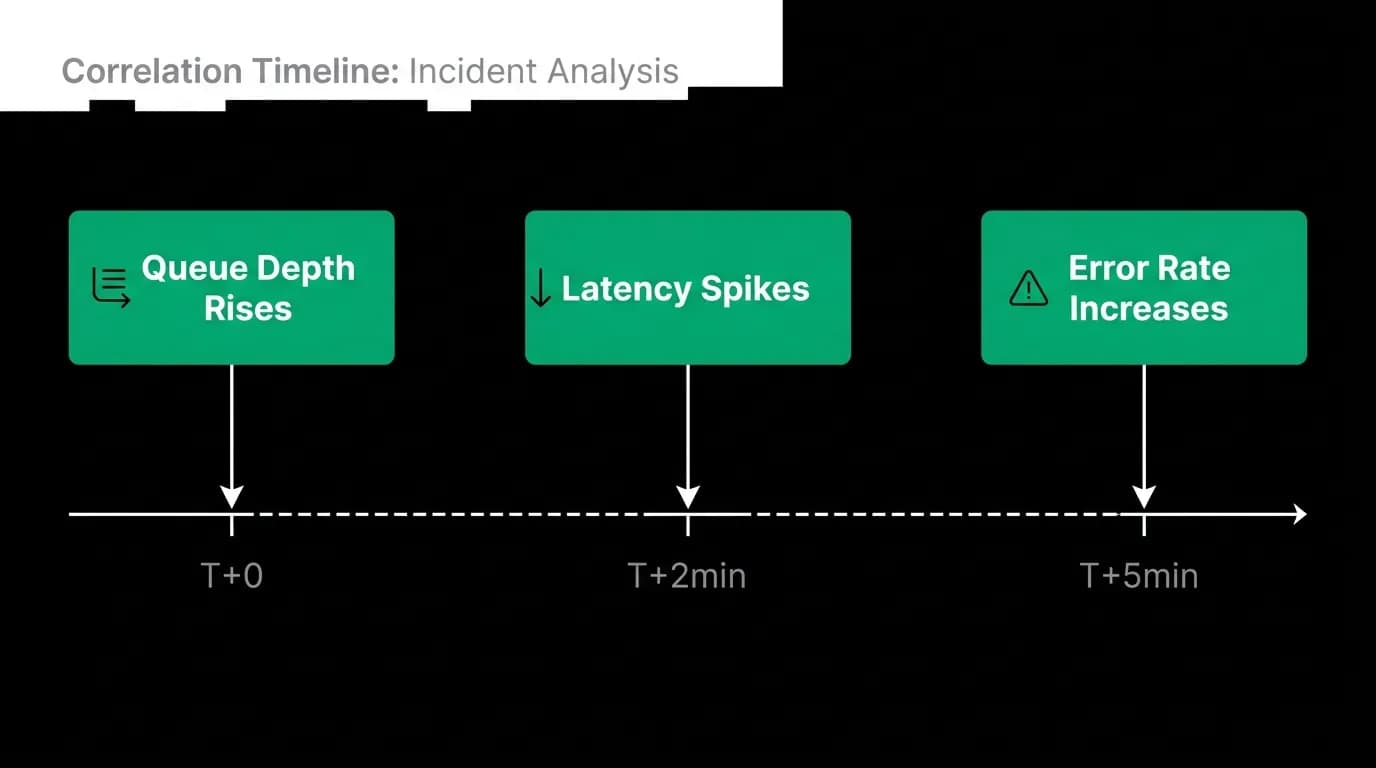
When a downstream service starts degrading, here's the sequence of events:
At T+0, the service responds slower. Jobs take longer to complete. Workers that used to finish a job in 200 milliseconds now take 2 seconds. But they're still completing. No errors yet.
At T+2 minutes, the queue starts growing. Jobs are being produced at the same rate, but consumed more slowly. Depth increases. Still no errors. Still no traveler-visible impact. Latency metrics for the main API are still fine because the affected operations are background jobs.
At T+5 minutes, the queue is deep. Workers are all busy with slow jobs. New jobs wait longer and longer. Some jobs start timing out. Error rates begin to rise. Travelers start noticing that confirmation emails are late, push notifications are delayed, trip records aren't updating.
At T+10 minutes, it's a full incident. Dead letter queue is filling up. Multiple alerts fire. Customer support gets tickets.
If you were monitoring queue depth, you had a 5-minute head start at T+2. That's enough time to scale up workers, restart a degraded service, or at least start investigating before it becomes traveler-facing.
Independent monitoring per queue
We run seven named queues, and each needs its own monitoring. A spike in the notification queue means something different than a spike in the booking queue. Aggregating them into a single "queue depth" number masks the signal.
The booking queue has the tightest thresholds. A depth above 10 for more than 30 seconds triggers investigation. This queue processes booking confirmations and trip updates. If it backs up, travelers don't see their bookings reflected in the app.
The notification queue has moderate thresholds. Depth above 50 for 2 minutes triggers an alert. Push notifications and emails can tolerate slightly more delay, but not much.
The analytics queue has the loosest thresholds. Depth above 500 for 10 minutes triggers a warning. Analytics processing can run behind without any traveler impact, but a persistently deep queue means our worker capacity is miscalculated.
Each queue's threshold is calibrated to its specific latency requirement. There's no universal "queue depth above X is bad" rule. It depends on what the queue processes and how time-sensitive that work is.
Correlating queue depth with service health
Queue depth alone tells you something is wrong. Correlating it with other metrics tells you what's wrong.
Queue depth rising + worker CPU flat = workers are waiting on external I/O. An external service (email delivery, push notification service, travel data provider) is slow. The fix is probably not more workers. It's figuring out why the external service is degraded.
Queue depth rising + worker CPU high = workers are compute-bound. The jobs themselves are taking too long. This might mean the job payload has gotten larger (a booking with 6 travelers generates more work than one with 1), or a code change made processing slower.
Queue depth rising + error rate rising = jobs are failing and retrying, which creates more queue entries that also fail. This is a cascading failure. The fix is usually to stop retrying temporarily (circuit break) until the root cause is fixed.
Queue depth stable but high = workers aren't keeping up with steady-state production. You need more workers, or your workers need to be more efficient. This is a capacity problem, not a degradation problem.
These correlations save us from knee-jerk reactions. "Queue is deep, add more workers!" is sometimes right and sometimes exactly wrong (if the problem is a slow external dependency, more workers just means more connections to the already-struggling service).
Auto-scaling on queue depth
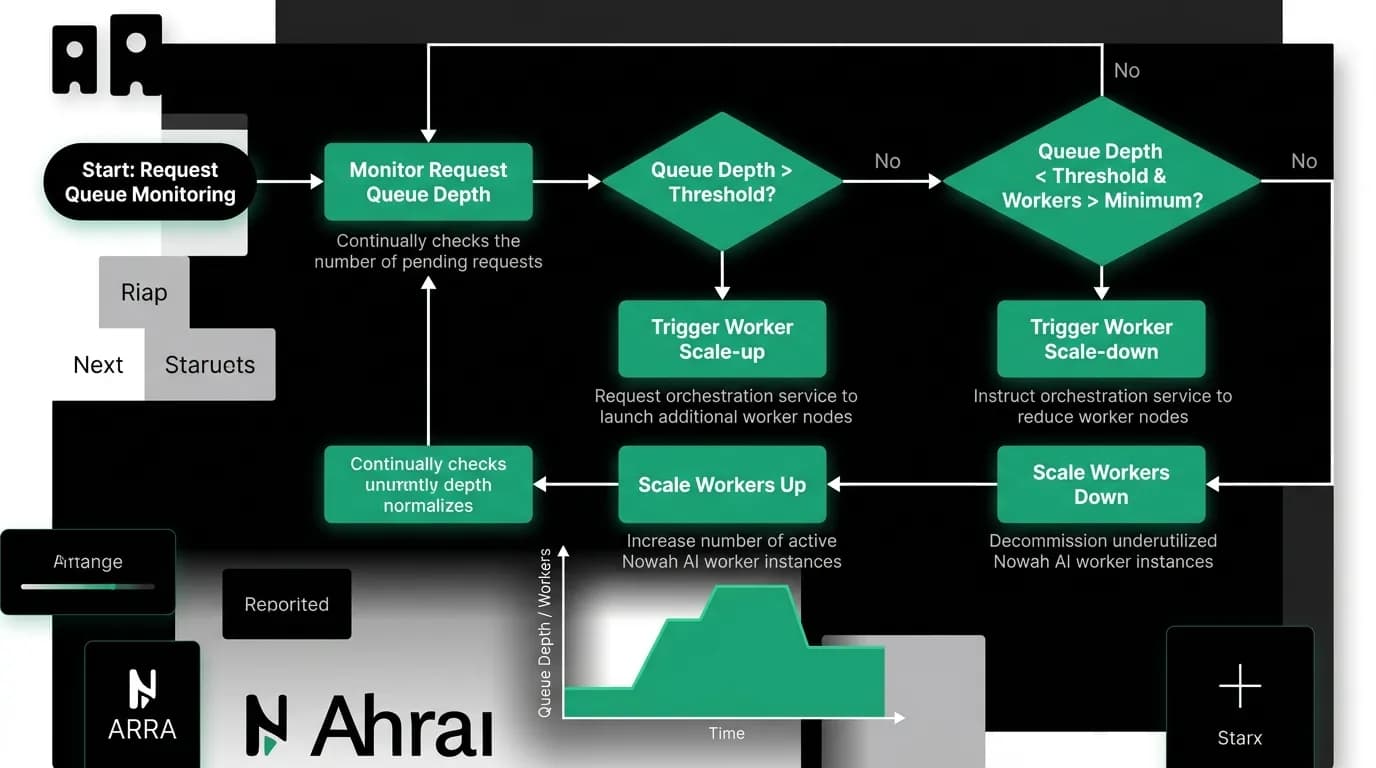
For our medium and low priority queues, we auto-scale worker count based on sustained queue depth.
The scaling logic is simple: if the queue depth exceeds a threshold for more than 2 minutes, add workers. If it drops below a lower threshold for 5 minutes, remove workers. The asymmetry is intentional. We scale up fast (2 minutes) and scale down slow (5 minutes) to avoid oscillation.
We don't auto-scale the booking queue workers. That queue has tight latency requirements and we'd rather have spare capacity sitting idle than risk a 2-minute scaling delay when bookings spike. Booking workers are provisioned for peak load plus headroom.
Auto-scaling on queue depth is more responsive than scaling on CPU or memory because queue depth reflects demand directly. CPU might be low because workers are waiting on I/O, but the queue is still growing. Scaling on CPU would miss that signal.
Seasonal patterns and capacity planning
Travel booking has strong seasonal patterns. Summer bookings spike in March and April. Holiday travel peaks in October and November. Individual events (a major music festival, airline fare sales) create smaller spikes.
We keep historical queue depth data and overlay it with traffic patterns. This lets us predict when queues will get stressed and pre-provision capacity. If we know that early March brings 3-5x normal booking volume as people plan summer trips, we can scale up workers before the spike arrives rather than reacting to it.
Historical data also helps us set thresholds. A queue depth of 20 might be alarming in January but normal in June. We adjust alert thresholds seasonally rather than using fixed values year-round. Fixed thresholds either alert too much during peak season (alert fatigue) or too little during quiet season (missed signals).
The minimum viable setup
If you're adding queue depth monitoring to your system, here's the minimum that gives you useful signal:
Expose queue depth on your health check endpoint. This is the simplest integration. Your existing monitoring system polls the health endpoint and records the depth.
Set up one alert per queue based on sustained depth. Not on instantaneous depth (too noisy) but on depth that stays elevated for more than a couple minutes.
Record historical depth with timestamps. You need the trend, not just the current value. A queue at depth 50 and falling is very different from depth 50 and rising.
Correlate with at least worker processing rate. If depth is rising and processing rate is falling, you have a real problem. If depth is rising and processing rate is constant, you're producing more jobs than usual (which might be expected during a traffic spike).
Don't aggregate across queues. Monitor each queue independently. The signal is in the individual queues, not the total.
Queue depth is unglamorous infrastructure. It doesn't make for exciting product demos. But it's one of the most reliable early warning systems we have. When the queue talks, we listen.
Nowah is an AI travel agent that searches and books real flights and hotels through conversation — no filters, no thirty open tabs. Plan your next trip.