Real-Time Log Streaming in the Terminal
`nowah logs tail` streams your API request logs with filtering, syntax highlighting, and search — giving you production observability without leaving the terminal.
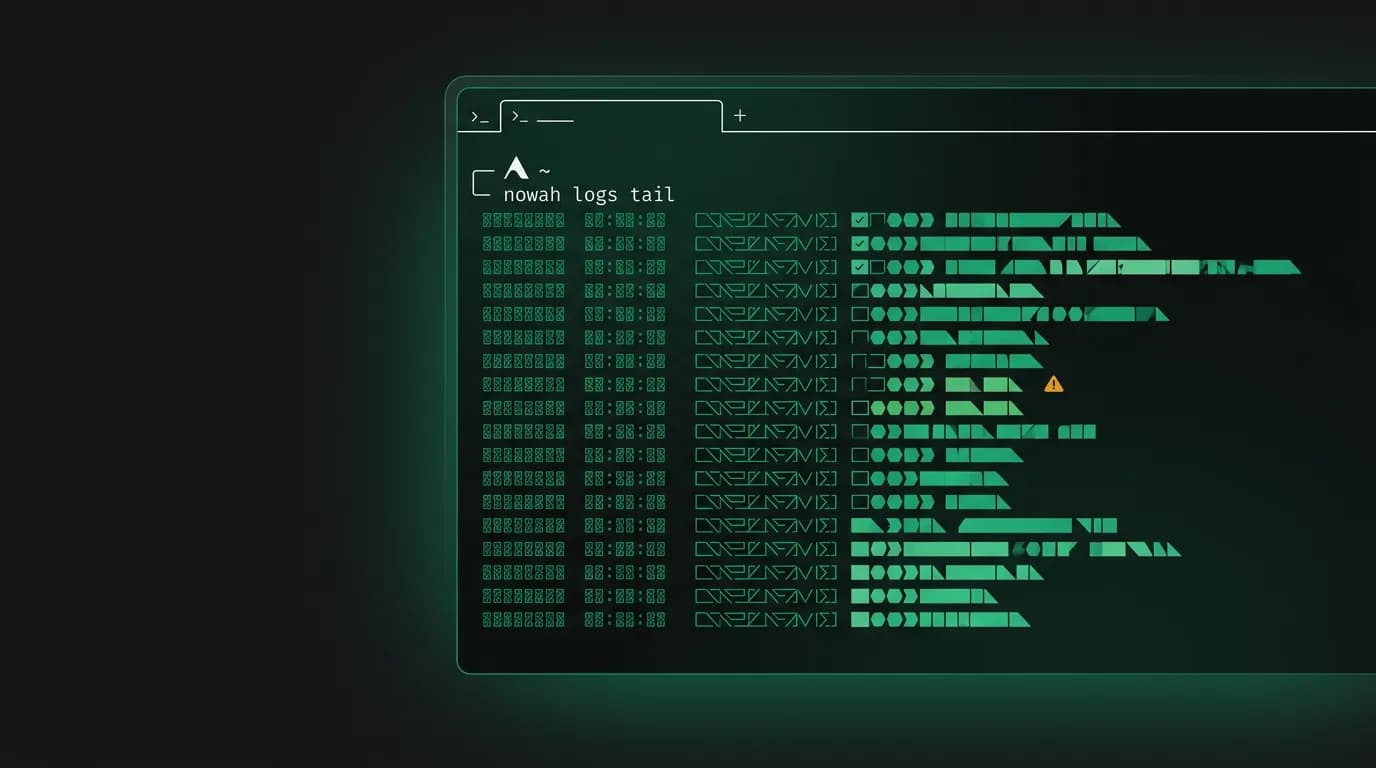
`tail -f` is one of the most used commands in software engineering. There is something irreplaceable about watching events flow in real time. You see patterns, catch anomalies, and build intuition about your system's behavior in a way that static dashboards cannot replicate.
`nowah logs tail` brings that experience to API request logs. It streams every API request your integration makes, with the response status, latency, and full request/response bodies. You watch your integration work in real time without leaving the terminal.
The streaming architecture
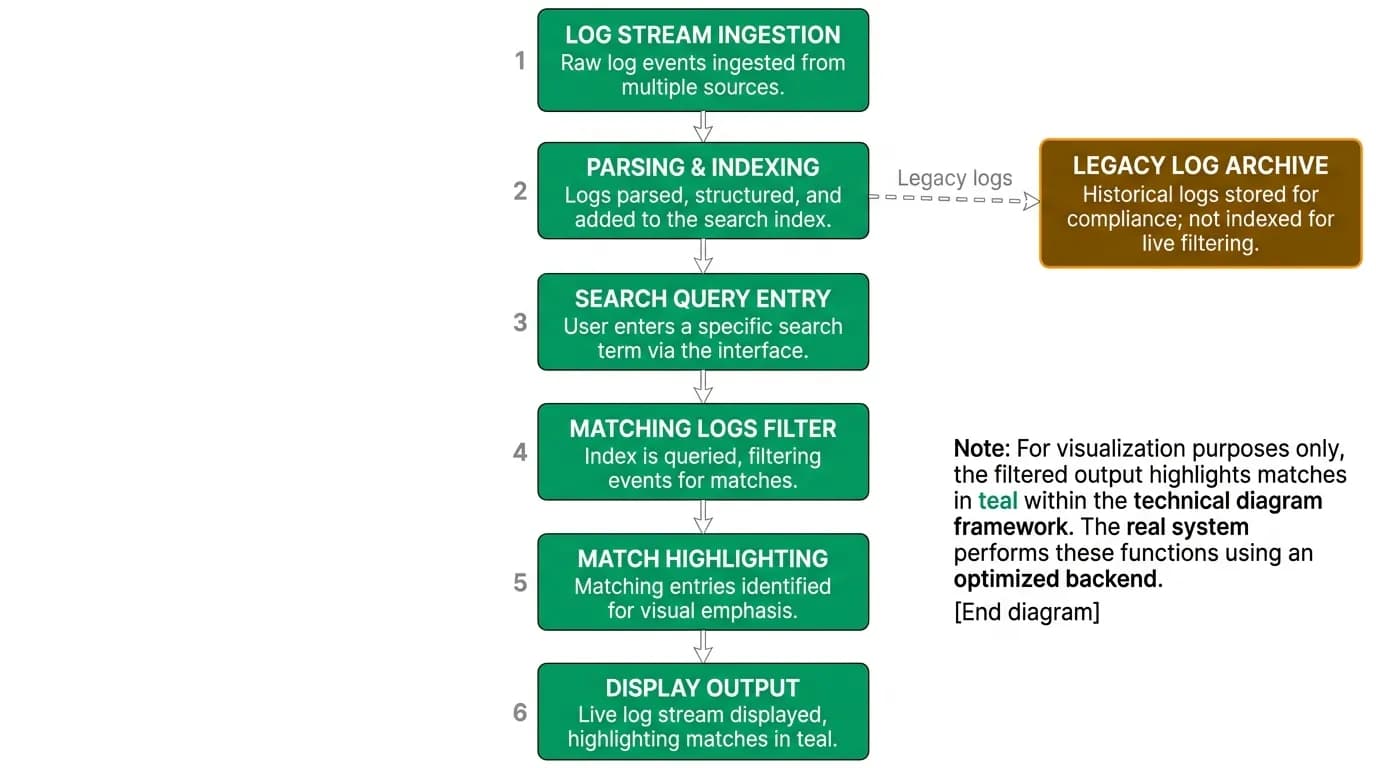
The log stream flows through three stages:
Server-side buffer. Every API request generates a log entry that includes the method, path, status code, response time, request body, response body, and request ID. These entries write to a rolling buffer that retains logs for your account's retention period (30 days on free tier, 90 days on paid).
server streaming stream. When the CLI connects, it opens an server streaming connection to the log streaming endpoint. New log entries push to the stream in real time. The connection includes backpressure handling — if the client cannot keep up with the volume, the server buffers entries rather than dropping them, up to a configurable limit.
CLI rendering. The CLI receives log entries and renders them with syntax highlighting, filtering, and formatting. Each entry displays on one summary line with expandable details.
[14:23:05] POST /flights/search 200 OK 847ms req_abc123
[14:23:06] POST /bookings 201 Created 1,234ms req_def456
[14:23:07] GET /bookings/bkg_789 200 OK 23ms req_ghi789
[14:23:08] POST /flights/search 429 Too Many 0ms req_jkl012
The summary line shows timestamp, method (color-coded), path, status code (color-coded), response time, and request ID. Green for 2xx, yellow for 4xx, red for 5xx. The request ID is there for every line so you can immediately drill into any entry.
Filter syntax
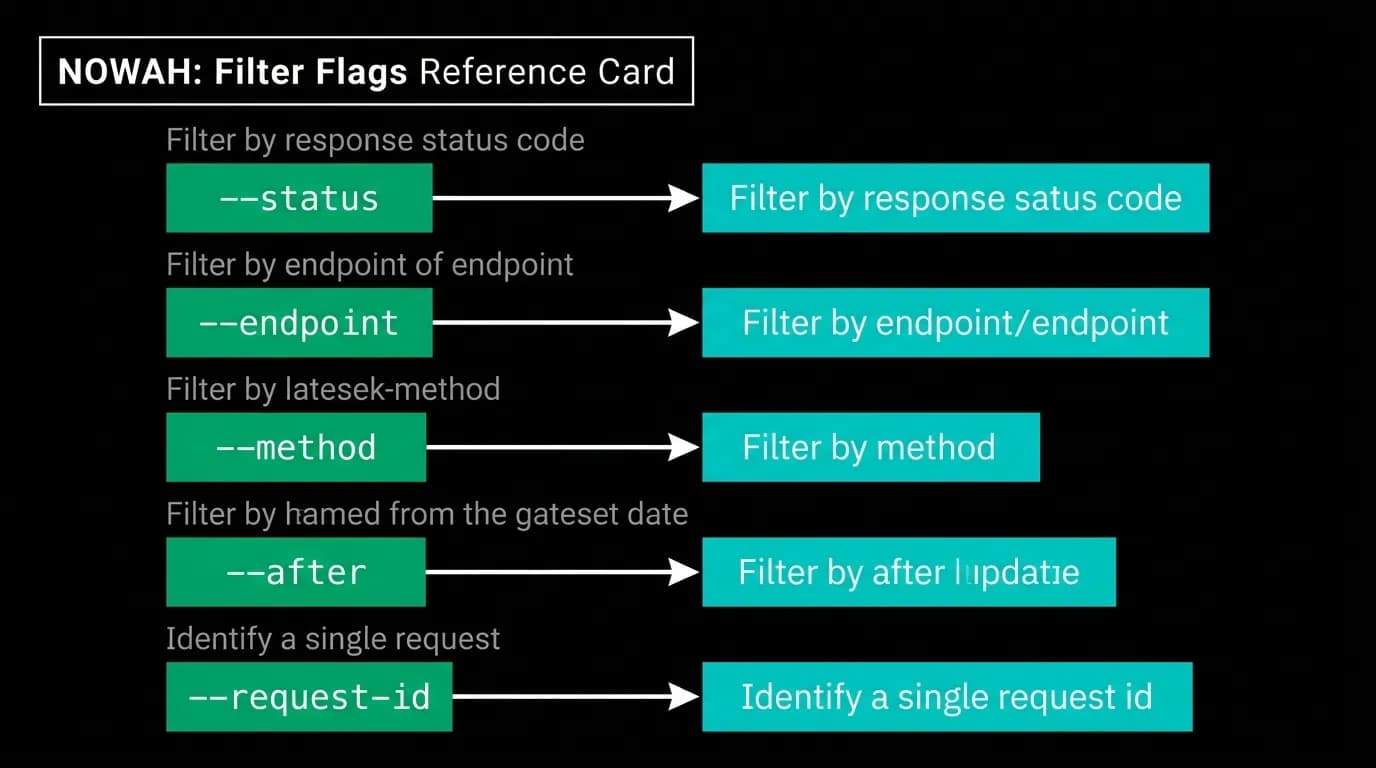
Most of the time, you do not want every log entry. You want specific ones. The filter syntax narrows the stream:
# Only show errors
nowah logs tail --status 4xx,5xx

# Only show flight search requests
nowah logs tail --endpoint /flights

# Only show POST requests
nowah logs tail --method POST

# Combine filters
nowah logs tail --status 5xx --endpoint /bookings --method POST

# Filter by request ID prefix
nowah logs tail --request-id req_abc

# Filter by time
nowah logs tail --after 2026-03-15T14:00:00Z
Filters are additive — multiple filters narrow the stream further. Status code filters accept ranges (`4xx` means 400-499) and individual codes (`429`). Endpoint filters support prefix matching (`/flights` matches `/flights/search` and `/flights/flt_abc123`).
Filters apply server-side, so only matching entries stream to the CLI. This keeps bandwidth low on high-volume accounts and prevents the terminal from being overwhelmed by irrelevant entries.
Search within the stream
While the stream is running, typing `/?` followed by a search term highlights matching entries:
/?OFFER_EXPIREDMatching log entries highlight in the terminal. The search is applied retroactively to entries already displayed and to new entries as they arrive. This is useful for monitoring a specific error code or watching for a particular booking ID in the stream.
Search is a client-side operation (unlike filters, which are server-side). It does not change which entries stream — it highlights within the existing stream. This distinction matters for high-volume accounts where you want the full stream visible but with specific entries called out.
Full request/response inspection
Each log entry in the stream is a summary line. Pressing Enter on any line (in interactive mode) or using `nowah logs get req_abc123` expands the full details:
Request:
 POST /flights/search HTTP/1.1
 Authorization: Bearer nwh_...
 Content-Type: application/json

 {
 "origin": "JFK",
 "destination": "CDG",
 "departureDate": "2026-06-15"
 }

Response:
 HTTP/1.1 200 OK
 X-RateLimit-Remaining: 87
 Content-Type: application/json

 {
 "success": true,
 "data": {
 "offers": [...]
 }
 }

Timing:
 DNS: 2ms | Connect: 15ms | TLS: 45ms | Server: 782ms | Transfer: 3ms | Total: 847ms
The full details include headers (with sensitive values redacted), the complete request and response bodies, and a timing breakdown showing where the latency went. This level of detail turns log streaming into a debugging tool — you can see exactly what was sent, what was received, and how long each phase took.
Combining with webhook forwarding
Running `nowah logs tail` and `nowah webhooks listen` in adjacent terminal panes gives you complete observability of your integration. The logs show your API calls and the webhooks show the events your integration receives.
You can correlate them using the request ID. A booking request in the log stream has a request ID. The booking confirmation webhook references the same request ID. If the booking succeeds in the logs but the webhook never arrives, you know the problem is in delivery, not in the booking itself.
This combination — log stream plus webhook stream — is the complete picture of an API integration. It replaces a dozen browser tabs of dashboards, log aggregators, and webhook inspection tools with two terminal windows.
Log streaming in the terminal is production observability at your fingertips. No browser context-switching, no dashboard loading times, no search queries across log aggregation tools. Just `nowah logs tail` and you are watching your integration work.
Nowah is an AI travel agent that searches and books real flights and hotels through conversation — no filters, no thirty open tabs. Plan your next trip.