Tracing a Booking Across Five Services
How correlation IDs and distributed tracing help us debug a booking that touched the AI agent, payment system, travel data provider, and notification system.

A traveler contacts support: "I booked a flight an hour ago but never got a confirmation email." Simple problem. The booking exists in their trip list. The payment went through. But no email.
Without distributed tracing, debugging this means searching logs in the API server for the booking, then searching payment service logs for the charge, then searching notification worker logs for the email job, then searching email delivery logs for the send attempt. Across four services, with different log formats, trying to correlate by timestamp. Maybe 20 minutes of work.
With distributed tracing, it's: look up the booking, find its correlation ID, search for that ID across all services. Every log entry from every service that touched this booking appears in one result set, ordered chronologically. The email job is there, with an error: "Template rendering failed: null departure_time." Three minutes to find the root cause.
That difference, 20 minutes versus 3, multiplied by every debugging session, adds up to thousands of engineering hours saved.
Correlation ID propagation
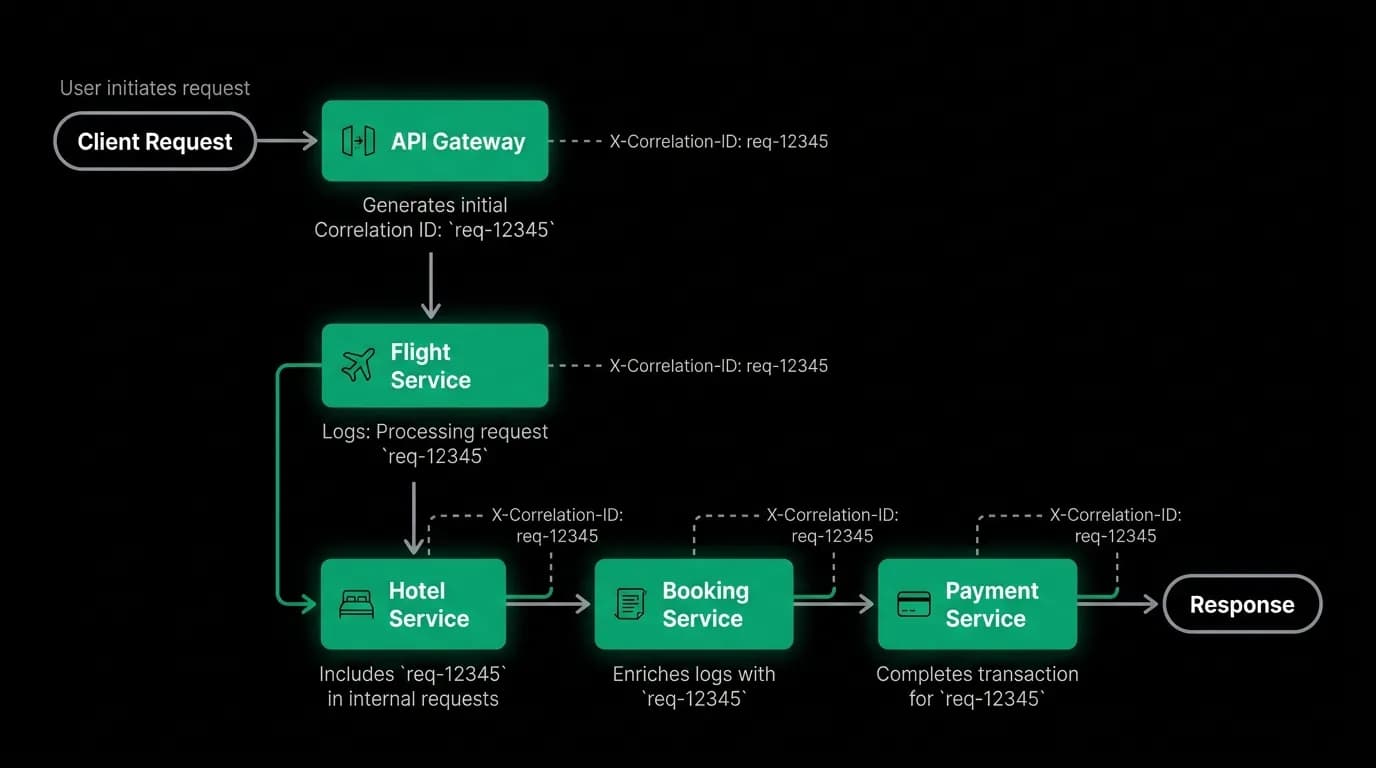
The mechanics are straightforward but require discipline across every service.
When a request enters our system at the API boundary, the middleware generates a unique correlation ID (a UUID). This ID is:
- Attached to every log entry the API server produces for this request.
- Included as an HTTP header in every downstream service call.
- Stored as metadata in every background job enqueued for this request.
- Saved to the database record (our ChatMessage model has a traceId field).
Each downstream service extracts the correlation ID from the incoming request and follows the same pattern: attach it to its logs, propagate it to its downstream calls, include it in its background jobs.
The result is a thread of correlation IDs that runs through the entire distributed transaction. A single booking might touch five or more services, generate dozens of log entries across them, and spawn multiple background jobs. The correlation ID ties them all together.
The discipline part is that every service must participate. If one service in the chain drops the correlation ID, the trace has a gap. We enforce this through shared middleware that automatically extracts and propagates the ID. Individual service code doesn't need to handle it manually.
Trace visualization
Raw log entries sorted by timestamp are useful but tedious. A trace visualization shows the same data as a waterfall chart: time on the horizontal axis, services on the vertical axis, with bars showing when each service was active and how long it took.
For a booking trace, the waterfall shows:
- API server receives the request (0ms).
- Authentication middleware verifies signed session tokens (5ms).
- AI agent starts reasoning (10ms).
- Flight search tool call to external API (10ms - 2500ms).
- Agent generates response (2500ms - 3000ms).
- Booking endpoint receives selection (3100ms).
- Payment intent created (3100ms - 3400ms).
- Travel provider confirmation (3400ms - 4800ms).
- Booking record written to database (4800ms - 4850ms).
- Background jobs enqueued (4850ms - 4900ms).
At a glance, we can see where time is spent. In this example, the flight search tool call (1-3) and the travel provider confirmation (4-8) dominate. Everything else is fast. If we want to speed up the booking, those are the two places to focus.
Identifying bottlenecks
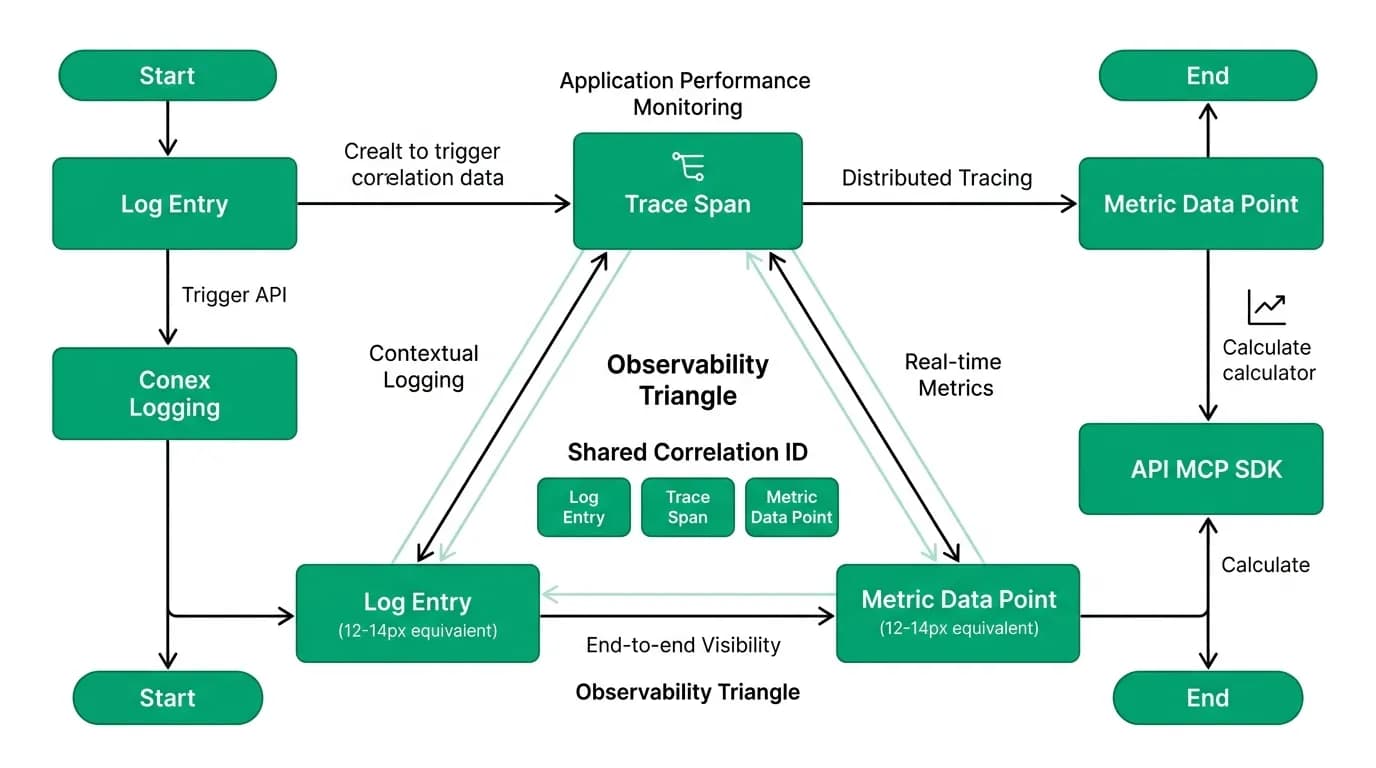
Traces across many bookings reveal patterns that individual traces don't. If the travel provider confirmation consistently takes 1.5 seconds but occasionally spikes to 8 seconds, we can see that in aggregate trace data. The P95 latency for that span tells us the worst case that 5% of travelers experience.
We've identified several bottlenecks this way:
The external flight search API has variable latency depending on route complexity. Direct routes return in under a second. Multi-city routes with connections can take 3-5 seconds. Now we know to set traveler expectations differently for complex searches.
Payment processing is fast for straightforward charges but slow when 3D Secure is required. The 3DS redirect adds 5-15 seconds of latency that's outside our control.
Background job processing is usually fast but can spike when the queue is deep. Traces that show a 30-second gap between "job enqueued" and "job started" indicate queue congestion.
The three pillars connected
Logs, traces, and metrics are the three pillars of observability. They're most powerful when connected.
A trace shows us that a booking took 12 seconds instead of the usual 5. The trace points to the payment service span as the slow one. We follow the correlation ID into the payment service logs and find a retry: the first payment attempt timed out at 5 seconds and was retried. The metric dashboard confirms that payment latency spiked for that 10-minute window.
Without traces, the metric spike is disconnected from individual bookings. Without logs, the retry is invisible. Without metrics, we don't know if this was an isolated incident or a pattern. All three together give us the full picture.
Sampling strategies
We can't trace everything. Full tracing of every request generates significant overhead in storage and processing. We use different sampling strategies for different request types.
100% tracing for bookings and payments. Every booking and every payment is fully traced. These are the highest-value transactions, and any failure needs to be fully debuggable. The volume is manageable because bookings are a small fraction of total requests.
Sampled tracing for chat messages. We trace a percentage of AI chat conversations. Enough to identify patterns, not so much that we drown in data. The sample rate adjusts based on error rate: when error rates rise, we automatically increase the sample rate to capture more failure cases.
Minimal tracing for [health checks](/blog/health-checks-liveness-probes-ai-services) and static assets. These high-frequency, low-value requests don't need individual tracing. We trace enough to verify the infrastructure is healthy, then sample the rest.
Adding tracing to your architecture
If you're building a multi-service system, here's the implementation roadmap.
Start with correlation IDs. Generate a unique ID at the edge and propagate it in HTTP headers. This requires no tracing infrastructure, just disciplined header management and log inclusion.
Add structured logging with the correlation ID as a standard field. Now you can search logs across services by correlation ID. This alone gets you 80% of the debugging benefit.
Add timing spans around major operations (database queries, external API calls, background job processing). This gives you the waterfall visualization for latency analysis.
Set up a trace aggregation service that collects spans from all services and assembles them into complete traces. This is where you invest in infrastructure.
Choose your sampling strategy based on transaction value. Trace everything for the paths that involve money. Sample for the rest.
Nowah is an AI travel agent that searches and books real flights and hotels through conversation — no filters, no thirty open tabs. Plan your next trip.