Measuring AI Product Quality: Metrics Beyond Accuracy
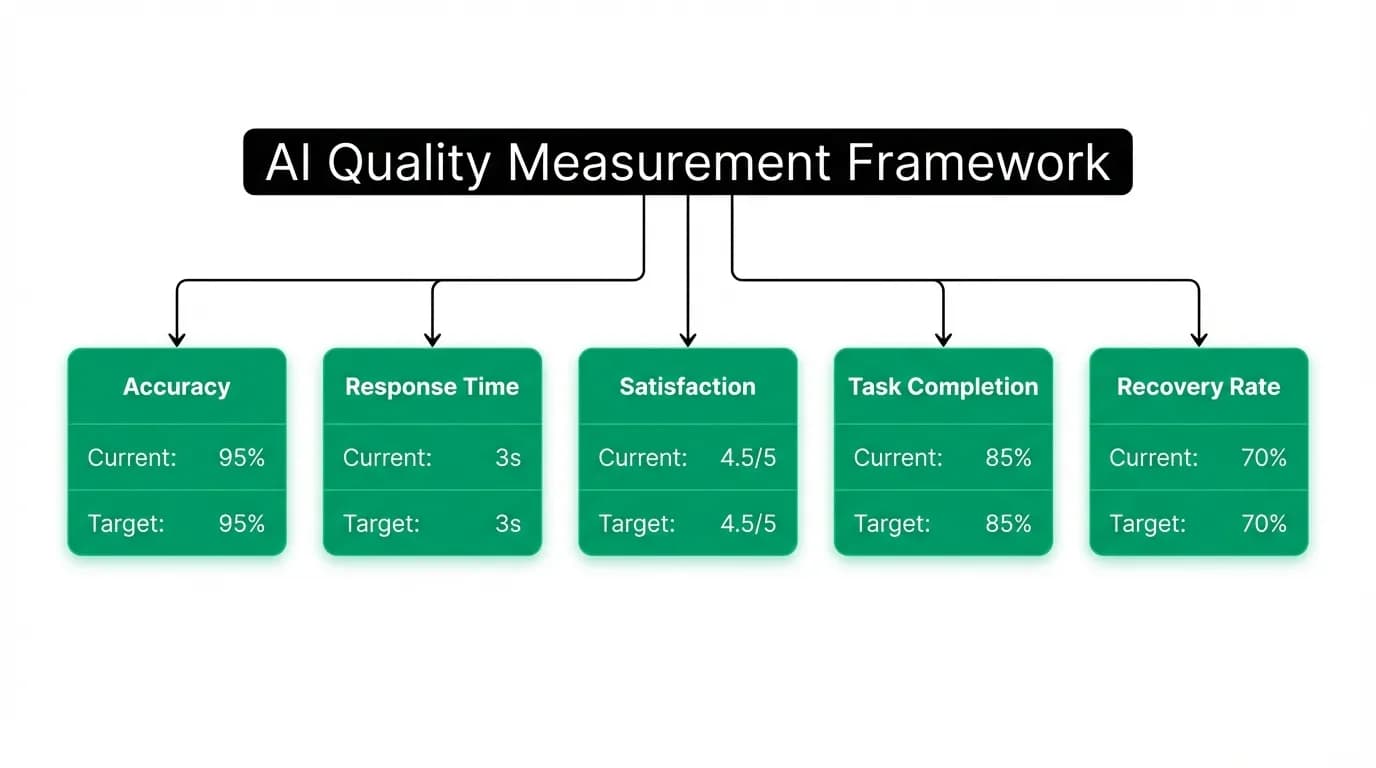
Accuracy is necessary but insufficient. Our framework adds response time, satisfaction, task completion, and recovery rate for a complete quality picture.

When people evaluate AI products, they default to accuracy. "Is the AI correct?" It is a reasonable question. It is also an incomplete one. An AI travel agent that gives you the right answer 95% of the time but takes 45 seconds to respond, provides no indication of confidence, and crashes ungracefully when it fails is a bad product. Accuracy is table stakes. Product quality is a multi-dimensional problem.
We learned this the hard way. Early versions of Nowah had strong accuracy in flight search results. The agent found good flights, priced correctly, on the right dates. But users were not satisfied, and we could not figure out why by looking at accuracy metrics alone. The problem was speed (responses took too long), context (the agent did not explain why it recommended a particular flight), and recovery (when the agent misunderstood a request, the conversation broke down).
We had to build a new measurement framework. Here is what it looks like.
Accuracy is table stakes, not the whole picture
Let me be clear: accuracy matters. If the agent tells you a flight costs $450 and it actually costs $550, that is a trust-destroying failure. If it recommends a hotel that does not exist, you lose all credibility. Factual accuracy for pricing, availability, and booking details must be near-perfect.
But accuracy alone tells you very little about product quality. Consider two scenarios:
Scenario A: The agent finds you the correct cheapest flight to London. It takes 30 seconds to respond. The response is a wall of text with flight details buried in a paragraph. No comparison to alternatives. No explanation of tradeoffs. Accuracy: 100%.
Scenario B: The agent finds three flights to London. It responds in 4 seconds with a streaming response that shows the search happening in real time. Each option is presented as a clean card with price, duration, stops, and a one-line AI assessment ("Best price, but 4-hour layover in Dublin"). The recommended option is based on your known preference for direct flights. Accuracy: 100%.
Same accuracy. Wildly different product quality. If you only measure accuracy, you cannot distinguish between these two experiences. And your users absolutely can.
The industry's fixation on accuracy as the primary AI metric comes from the model evaluation world, where benchmarks test correctness on standardized tasks. But a product is not a benchmark. Users do not grade on correctness alone. They grade on how the entire experience feels, from the moment they ask a question to the moment they have an answer they can act on.
Response time: the speed of useful output
We track response time not as "time to first token" (how fast the AI starts generating text) but as "time to useful output" (how fast the user gets information they can act on).
These are different. An AI agent can start streaming text immediately, but if the first 15 seconds of output are the agent thinking out loud about how to interpret your request, the time to useful output is still 15 seconds. Users do not care about tokens. They care about answers.
For flight search, we measure time from user message to flight cards appearing in the chat. For hotel search, same thing. For conversational responses, we measure time from message to the core answer (not the preamble, not the caveats, the actual answer).
Our targets:
- Simple questions (weather, visa, general info): under 3 seconds
- Flight search: under 8 seconds from request to cards displayed
- Hotel search: under 10 seconds
- Complex multi-step queries: under 15 seconds, with progress indicators throughout
Speed interacts with perceived quality in non-obvious ways. Users forgive a 10-second wait for flight search because they know it involves querying live databases. They do not forgive a 10-second wait for "What is the capital of France?" The expected response time is calibrated to the perceived complexity of the request.
Streaming helps enormously. When users see the agent actively working, searching inventory, comparing options, the perceived wait time drops even if the actual time is the same. This is why we invested heavily in streaming UI. Not because it is technically required, but because it transforms a waiting experience into a watching experience, and those feel completely different.
User satisfaction: qualitative signals alongside numbers
We measure satisfaction through a combination of explicit and implicit signals.
Explicit: after a booking or a significant interaction, we occasionally ask users to rate the experience. Simple thumbs up or thumbs down, with an optional text field. The response rate is around 15%, which is typical for in-product feedback. We do not ask after every interaction because feedback fatigue kills response quality.
Implicit signals tell us more and arrive without asking. These include:
- Rephrasing rate: How often does a user rephrase their question? High rephrasing means the agent did not understand or the response was not useful. If a user says "flights to Paris" and then immediately says "I meant flights from New York to Paris, not London to Paris," that is a satisfaction failure even if the second response is perfect.
- Abandonment after response: Did the user read the agent's response and then leave the conversation? If the agent presents three flight options and the user does not select any or ask follow-up questions, the options probably did not match what they wanted.
- Follow-up depth: Happy users go deeper. They ask follow-up questions, explore alternatives, and move toward booking. Dissatisfied users disengage or restart with a completely different query.
- Repeat usage: The strongest satisfaction signal. Users who come back within a week had a good experience. Users who do not come back for months (or ever) did not.
We combine these into a composite satisfaction score that weighs explicit feedback heavily but supplements it with implicit signals. The implicit signals are noisier but cover 100% of interactions, not just the 15% where users bother to give feedback.
Task completion rate: did the user get what they came for?
This is the metric that ties everything together. Did the user accomplish what they set out to do?
For a travel booking app, the ultimate task completion metric is booking rate: of users who expressed intent to book, what percentage actually completed a booking? But booking is a high bar and a lagging indicator. We also track intermediate completions:
- Search completion: User asked for flights or hotels. Did the agent return results? (Target: 98%)
- Selection: Results were shown. Did the user select one? (Target: 60%)
- Review initiation: User selected an option. Did they start the booking review? (Target: 75%)
- Booking completion: User started review. Did they complete the booking? (Target: 80%)
Each stage has a drop-off rate, and each drop-off has a cause. Failure at the search stage is an AI accuracy or capability problem. Failure at selection is a curation quality problem (the options did not match preferences). Failure at review is a pricing or trust problem. Failure at booking is a payment or UX problem.
We also track task completion for non-booking interactions. Did the user get a useful answer to their destination question? Did the currency conversion happen successfully? Did the agent correctly identify visa requirements for the user's nationality and destination?
Task completion is the closest thing we have to a single metric that captures "is the product working?" A product with high accuracy but low task completion is accurate but unhelpful. A product with high task completion is, by definition, helping users do what they came to do.
Recovery rate: handling failure gracefully
Here is the metric that most AI product teams ignore entirely, and it might be the most important one.
Recovery rate measures: when the AI makes a mistake, how often does it successfully recover and still complete the user's task?
AI will make mistakes. The model will misinterpret requests. Search results will occasionally be wrong. Availability information will be stale. The question is not whether failures happen but what happens after they do.
We categorize recovery into three types:
Self-recovery: The agent detects its own error and corrects without user intervention. "Actually, I searched for the wrong dates. Let me search again for April 7-10." This is the gold standard.
Prompted recovery: The user corrects the agent, and the agent adjusts successfully. "No, I said London, not Lisbon." The agent re-searches for London without losing conversation context. Good but not great.
Failed recovery: The user corrects the agent, but the conversation breaks down. The agent loses context, returns irrelevant results, or enters a loop. This is the worst case and the primary driver of user churn.
Our recovery rate target is 85%: of all interactions where the agent makes an error, 85% should result in successful task completion after recovery. This is hard. Recovery requires the agent to maintain conversation context across the error, understand what went wrong, and adjust without repeating the mistake.
We track recovery rate as a first-class metric because it directly predicts user trust. Users who experience a graceful recovery actually report higher satisfaction than users who never encountered an error at all. There is something reassuring about seeing the AI acknowledge a mistake and fix it. It feels human.
Building the composite quality score
Five metrics: accuracy, response time, satisfaction, task completion, recovery rate. Each tells part of the story. None tells the whole story. We combine them into a composite quality score that gives us a single number for "how good is the product right now?"
The weighting is not equal. Task completion gets the highest weight (30%) because it is the most direct measure of product value. Satisfaction gets 25% because it captures the experiential dimension that other metrics miss. Accuracy and response time get 20% each because they are foundational. Recovery rate gets 5% because it applies to a subset of interactions (only those where errors occur).
The composite score is not a vanity metric. It drives real decisions. When the score drops, we dig into which dimension caused the drop and prioritize fixes accordingly. When we ship a change, we watch the composite score for the following week. If it improves, the change was good. If it drops, we investigate.
The score also enables comparison across time periods. We can say "the product is 12% better than it was three months ago" in a way that is more meaningful than any single metric change. A 12% composite improvement might mean accuracy stayed flat, but response time dropped by 2 seconds, satisfaction went up 8%, and task completion improved by 5%. That is a meaningfully better product even though accuracy did not change.
How quality metrics drive product decisions
Let me give a concrete example of metrics-driven product improvement.
Three months ago, our task completion rate for hotel bookings was 38%, compared to 52% for flights. We dug into the funnel. Hotel search completion was fine (95%). The drop-off was at selection: users would see three hotel options and then either ask for more options or abandon the conversation.
The satisfaction signals told us more. Users who abandoned hotel search had a high rephrasing rate during the selection phase: "Do you have anything more boutique?" or "These are too far from the center." The options were accurate but not well-matched to preferences.
The fix was not more accuracy. It was better curation. We improved how the agent weighs location, style, and past preferences when selecting the three hotels to present. We also added neighborhood context to each option: "This hotel is a 5-minute walk from the Gothic Quarter, the area you mentioned loving when you visited two years ago."
Hotel task completion went from 38% to 49% in six weeks. Accuracy did not change. Speed did not change. But the product got materially better because we improved the dimension that actually mattered for that specific problem.
That is the power of a multi-dimensional quality framework. It points you at the right problem. If we had only measured accuracy, we would have been mystified by why users were not booking hotels. The numbers would have looked fine. The product would have stayed mediocre.
Quality in AI products is not a single number. It is a shape, a profile across multiple dimensions. And the shape tells you what to work on next.
Nowah is an AI travel agent that searches and books real flights and hotels through conversation — no filters, no thirty open tabs. Plan your next trip.